Getting Started
Create a new Cargo project, and include Balter in your Cargo.toml.
[dependencies]
balter = "0.6"
Then, at the top of main.rs (or the file you want to use Balter functionality in):
use balter::prelude::*;
Building Blocks
The two abstractions Balter provides are the Scenario and the Transaction. A Scenario is some characteristic load you want to run, such as an average user work-flow, and it must call one or more Transactions (directly or indirectly). The Scenario is the test, and the Transaction is how Balter keeps track of whats going on.
To perform a load test, Balter creates many instances of a Scenario and runs them in parallel. It then keeps track of statistical information around the Transactions, and is able to rate-limit outgoing transactions, increase concurrency, distribute the work to other machines, etc.
Transactions
A Transaction is a single request to your service. A Transaction is the way Balter measures the number and timing of requests being made to the service, as well as the error rate and success rate. These are used to make various scaling decisions.
You denote a Transaction with the #[transaction] macro.
Currently Balter only supports Transactions which are async functions with any number of arguments that return a Result<T, E>(Issue #7
)
#[transaction]
async fn foo(client: &Client) -> Result<(), Error> {
    ...
}

#[transaction]
async fn bar(client: &Client, val: &Val) -> Result<u32, Error> {
    ...
}
NOTE: Balter keeps track of the error rate by checking if the Result is Ok() or Err(), so if you are using something like reqwest, you will likely want to match on the Response to ensure errors are propagated correctly:
// Issue: This will only have an error on certain network failures.
#[transaction]
async fn foo(client: &Client) -> Result<(), Error> {
    let res = client.post(MY_URL)
        .json(..)
        .send()?
        .await;

    Ok(())
}

// Solution: Check the response to return an Error if its not 2XX.
#[transaction]
async fn foo(client: &Client) -> Result<(), Error> {
    let res = client.post(MY_URL)
        .json(..)
        .send()?
        .await;

    if res.status.is_success() {
        Ok(())
    } else {
        Err(Error::FailedTransaction)
    }
}
Current Restrictions
#[transaction]can only be used on functions which return aResult<T, E>( Issue #7 )
Scenarios
A Scenario is a function which calls any number of Transactions, either directly or indirectly. They contain the logic for the load test you want to run against your service.
A Scenario is denoted with the #[scenario] macro.
Currently, a Scenario must be a function which takes no arguments and returns no argument (Issue #1
).
For example, the following is a simple Scenario, which calls the same transaction repeatedly,
#[scenario]
async fn scenario_foo() {
    loop {
        let _ = call_fetch_endpoint().await;
    }
}

#[transaction]
async fn call_fetch_endpoint() -> Result<()> {
    ...
}
Current Restrictions
#[scenario]can only be used on functions which take and return no arguments ( Issue #1 )
Functionality
Methods
A Scenario has additional methods you can use, all of which run the Scenario as a load test.
.tps(u32)Run a Scenario such that the transactions per second is equal to the value set..error_rate(f64)Constrain transaction rate to an average error rate..latency(Duration, f64)Constrain transaction rate to a specific latency at a given percentile..duration(Duration)Limit the Scenario to run for a given Duration (by default it runs indefinitely)
These methods can be used together. For example, let's say you want to scale a function to achieve a p90 latency of 200ms, but not go over 10,000 TPS or an error rate of 3%, and run it for 3600s:
test_scaling_functionality()
    .latency(Duration::from_millis(200), 0.90)
    .tps(10_000)
    .error_rate(0.03)
    .duration(Duration::from_secs(3600))
    .await;
Hints
For certain Scenarios it can be useful to provide hints for how Balter should run them. This is primarily useful for speeding up the control loops that Balter uses internally, which are designed to work for a wide variety of use-cases and can sometimes be slow. Currently Balter provides one kind of hint, the Hint::Concurrency which Balter will use as the starting concurrency for a given Scenario:
use balter::{prelude::*, Hint};

my_scenario()
    .tps(10_000)
    .hint(Hint::Concurrency(100))
    .await;
Statistics
Scenario's will return statistical information about the run. For example,
let stats = scenario_foo()
    .tps(10_000)
    .duration(Duration::from_secs(10))
    .await;

assert!(stats.actual_tps > 9_900.);
assert!(stats.error_rate < 0.1);
NOTE: You will need to provide a .duration() call to take advantage of this data, otherwise the Scenario runs indefinitely.
Basic Example
Putting everything together, the following is an example of a single-server load test using Balter.
use balter::prelude::*;

#[tokio::main]
async fn main() {
    // Run a scenario in parallel for 3600s such that:
    // - Max 5,000 transactions per second
    // - Max p95 latency is 20ms
    // - Max error rate is 3%
    basic_user_requests()
        .tps(5_000)
        .latency(Duration::from_millis(20), 0.95)
        .error_rate(0.03)
        .duration(Duration::from_secs(3600))
        .await;
}

// A Scenario is just an async Rust function, and
// can contain any complex logic you need.
#[scenario]
async fn basic_user_requests() {
    let client = reqwest::Client::new();
    loop {
        let _ = call_api(&client).await;
    }
}

// A Transaction is also just an async Rust function, and
// provides flexibility with what you want Balter to measure
// and constrain on.
#[transaction]
async fn call_api(client: &Client) -> Result<(), Error> {
    let res = client.post("https://example.com")
        .json(data)
        .send()
        .await;

    if res.status.is_success() {
        Ok(())
    } else {
        Err(Error::BAD_REQUEST)
    }
}
Metrics
Balter has a default feature to emit metrics via the metrics crate. This makes Balter metrics agnostic to your metrics system. Please see the metrics crate for more information. An example of a metrics adapter for Prometheus:
PrometheusBuilder::new()
    .with_http_listener("0.0.0.0:8002".parse::<SocketAddr>()?)
    .install()?;
The list of metrics is as follows:
{transaction}=> Function name for the#[transaction]{scenario}=> Function name for the#[scenario]
| Metric Name | Purpose | Values |
|---|---|---|
| Basic Metrics: | ||
{transaction}_success | Transactions which are successful | Integer (counter) |
{transaction}_error | Transactions which are errors | Integer (counter) |
{transaction}_latency | Latency per transaction | Seconds (histogram) |
| Basic Internals Metrics: | ||
balter_{scenario}_concurrency | Number of concurrent tasks per Scenario | Integer |
balter_{scenario}_goal_tps | Set-point for TPS | Integer |
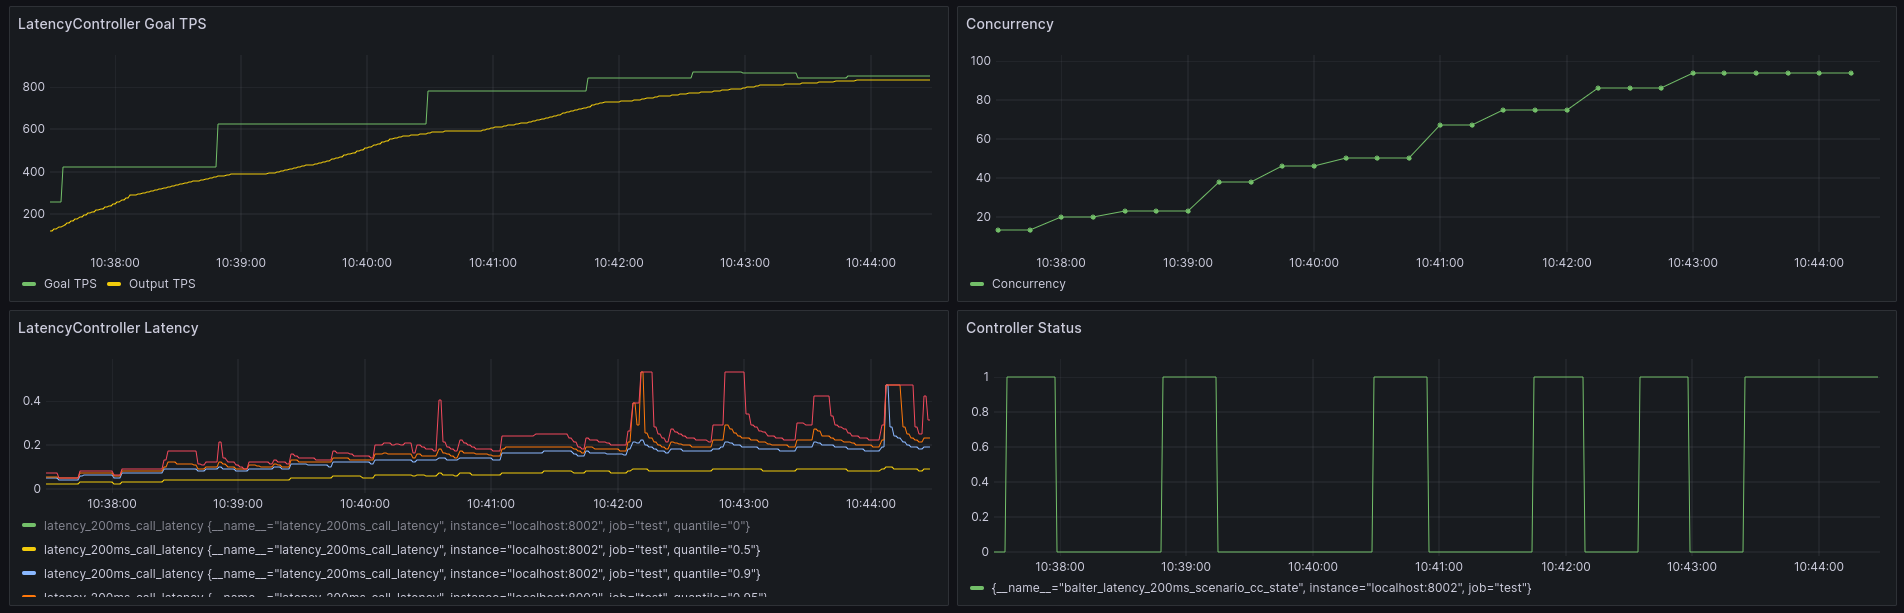
| Advanced Internals Metrics: | ||
balter_{scenario}_lc_goal_tps | Set-point for TPS (LatencyController) | Integer |
balter_{scenario}_erc_goal_tps | Set-point for TPS (ErrorRateController) | Integer |
balter_{scenario}_cc_state | ConcurrencyController state | 0: Stable, 1: Working, -1: TPS Limited |
balter_{scenario}_erc_state | ErrorRateController state | 0: Stable, 1: SmallStep, 2: BigStep |
Distributed Runtime (Experimental)
Running a load test on a single server is limited, and Balter aims to provide a distributed runtime. Currently Balter supports distributed load tests, but they are fragile and not efficient. This functionality will improve over time, but the current support should be considered experimental.
To use the distributed runtime, you need to set the rt feature flag. You will also need to add linkme to your dependencies list.
[dependencies]
balter = { version = "0.3", features = ["rt"] }
linkme = "0.3"
The next step is to instantiate the runtime. This is needed in order to set up the server and gossip functionality.
use balter::prelude::*;

#[tokio::main]
async fn main() {
    BalterRuntime::new().with_args().run().await;
}
Note that we call .with_args() on the runtime. This sets up the binary to accept CLI arguments for the port (-p) and for peer addresses (-n). You can also use the builder pattern with .port() and .peers(), which are documented in the rustdocs. In order to have distributed load testing support, each instantiation of the service needs to know of the address of at least one peer, otherwise the gossip functionality won't work. Support will be added for DNS support to allow for more dynamic addresses. With the runtime configured, you can spin up the servers.
Assuming the first server is running on 127.0.0.1:7621 (the first server does not need any peer addresses), each subsequent service can be started like so:
$ ./load_test_binary -n 127.0.0.1:7621
Once the services are all pointed at each other, they will begin to gossip and coordinate. To start a load test, you make an HTTP request to the /run endpoint of any of the services in the mesh with the name being the function name of the scenario you would like to run.
The data-structure is as follows (using ? to denote optional fields):
{
    "name": "{scenario_name}",
    "duration?": "float", // Duration in seconds
    "max_tps?": "integer",
    "error_rate?": "float", // Between 0. and 1.
    "latency?": {
        "latency": "float", // Latency in seconds
        "quantile": "float", // Between 0. and 1. (eg. p95 = .95)
    }
}
An example running against a server:
$ # For running a TPS load test
$ curl "127.0.0.1:7621/run" \
    --json '{ "name": "my_scenario", "duration": 30, "max_tps": 10000, "error_rate": 0.05, "latency": { "latency": "0.02", "quantile": 0.95 } }'
Patterns
Indefinite Background Load
It can be useful to have a steady-state background load when testing edge-cases. The easiest way to do this is to simply tokio::spawn() a task running the background load scenario. For example,
tokio::spawn(async {
    background_load()
        .tps(10_000)
        .error_rate(0.05)
        .await;
});

// Wait for the background load to stabilize
sleep(Duration::from_secs(300)).await;

test_edge_case_load()
    .latency(Duration::from_millis(1_000), 0.9)
    .duration(Duration::from_secs(3600))
    .await;

sleep(Duration::from_secs(300)).await;

disable_servers().await;

test_edge_case_load()
    .latency(Duration::from_millis(1_000), 0.9)
    .duration(Duration::from_secs(3600))
    .await;
Parallel Tests
You can use the tokio::join! macro to run two Scenario's in parallel:
tokio::join! {
    async {
        // First, set up a background load which either hits
        // 10K TPS, has a p95 latency of 200ms or has an
        // error rate of 5%
        set_background_load()
            .tps(10_000)
            .latency(Duration::from_millis(200), 0.95)
            .error_rate(0.05)
            .await;
    },
    async {
        // After 300s of waiting, test our scaling ability
        // by running a scenario which achieves either
        // 100K TPS or a p90 latency of 1,000ms
        sleep(Duration::from_secs(300)).await;

        test_scaling_functionality()
            .tps(100_000)
            .latency(Duration::from_millis(1_000), 0.90)
            .duration(Duration::from_secs(3600))
            .await;
    },
}
Debugging
TPS Limited
One of the warning messages you might see from Balter is "Unable to achieve TPS on current server." What this means is that Balter has detected it has maxed out on the TPS it is able to output for the given Scenario. This can be the case for a few reasons, and this section will cover how Balter detects this and ways to diagnose what might be going wrong.
The way Balter works under-the-hood is by increasing concurrency for a given Scenario in order to increase the TPS. However, in the case of an external bottleneck, increasing concurrency might not lead to an increase in TPS -- in fact, it might lead to a decrease as contention is increased. For instance, if you set a Scenario to run with .tps(10_000), but the network card is bottlenecked at 5,000 TPS, you don't want to indefinitely increase concurrent tasks.
To detect situations where the TPS is limited, Balter keeps track of pairs of (concurrency, measured_tps) as it scales up. It then runs a simple slope comparison algorithm to determine if an increase in concurrency has not increased the measured_tps, at which point we know there is a bottleneck.
The metrics provided by Balter can give insight into where the bottleneck might be. The success/error, latency and concurrency measurements are going to be the most useful. You can also use the distributed runtime feature of Balter in order to scale out to additional servers.